
Report
Equal pay report 2025
Updated on 26 April 2025
Introduction
This Equal Pay Report summarises the University of Dundee’s data relating to staff pay and the protected characteristics of sex, age, ethnic origin and disability in line with its obligations under the Public Sector Equalities Duty to publish Gender Pay Gap and Equal Pay information. This information was last published in 2023 based on data collected in 2022 and the University’s aim is to publish this report on an annual basis so that it has a clearer and more current understanding of progress on Equal Pay Issues.
Our Commitment to Equality, Diversity and Inclusion and Equal Pay
The University of Dundee is committed to advancing equality, diversity and inclusion in all of its practices. We continue to develop an inclusive culture that is underpinned by our core values of: valuing people, working together, integrity, making a difference and excellence to support the University’s vision to be recognised as Scotland’s leading University. The University of Dundee believes in the importance of equality, diversity and inclusion in each of its functions and activities.
The University believes this extends to the way we reward our staff and that pay should be awarded fairly and equitably regardless of protected characteristics. The University believes that all employees should receive equal pay for the same or broadly similar work, for work rated as equivalent and for work of equal value. The University recognises that to achieve equal pay for employees carrying out equal work we should operate a pay system which is transparent, based on objective criteria and free from bias. The University uses the Higher Education Role Analysis (HERA) system, an analytical job evaluation system, to assist with determining equal pay. It is important that all employees have confidence in our processes, and to enable this, we will continue to work with the recognised trade unions to ensure equality within our reward policy and practice.
About the Data
The Public Sector Equality Duty consists of a general duty (Equality Act 2010) and specific duties (Equality Act 2010 (Specific Duties) (Scotland) Regulations 2012) amended by The Equality Act 2010 (Specific Duties) (Scotland) Amendment Regulations 2016. Under this legislation HEI’s are required to publish gender pay gap information every two years and advised to publish data on the percentage difference between male and female average hourly pay, excluding overtime.
The University routinely collects data from staff in order that it can meet its data collection and reporting obligations to HESA (The Higher Education Statistics Agency). HESA is the official agency for the collection, analysis and dissemination of quantitative information about higher education. The University reports annually to HESA including on employees’ Protected Characteristics data. The definitions and categories used in this report reflect those required by HESA. In the case of Ethnicity, throughout the report/paper, we have used the acronym ‘BME’ and the term ‘ethnic minority’ interchangeably to denote all those social groups who have been subject to historic and contemporaneous forms of racism and exclusion. We are attentive to the fact that such aggregate forms of conceptualisation are not always ideal and can sometimes mask important differences between groups, and so, when the data are sufficiently robust, we also present information that is disaggregated into categories like Black, Asian and Mixed.
There are gaps in the data held by the University in relation to all protected characteristics other than sex and age, resulting from non-disclosure of information by staff. In total, there is a 23% data gap across all data points relating to Disability (18% gap), Ethnicity (15% gap), Sexual Orientation (34% gap) and Religion (26%). In this report this is reflected in differences between average hourly pay calculated for all staff by Sex, Ethnicity and Disability and means that the average calculated pay gap may not be an accurate reflection of the true position.
The data used is a snapshot of salaried post holders recorded in the university’s HR system as at 1st January 2025, and does not include non-salaried post holders. The calculated average hourly pay is based on 52 weeks, and 35 hours per week, across all posts and includes any regularly payable allowances and supplements. There are 3404 post holders whose data is analysed within this report.
Reference to average hourly pay in this report relates to the mean value of all values in a range, whereas the median is the middle point between the lowest and highest points in the range. Quartiles have been determined by taking the points at 25% intervals between the lowest and highest points.
Where negative pay gap values are shown this indicates a pay gap in favour of the marginalised group. This normally indicates the greater proportion of the marginalised group making up the staff in that area.
The “Close the Gap” advice is that a gap under 3% is statistically insignificant, gaps between 3% and 5% should be investigated and a gap of above 5% should be acted upon.
Key Points
- Sex - The University’s overall gender pay gap is 14.8% in favour of men based on average hourly-pay. This has increased marginally from 13.8% in 2022. This compares to 14.4% for Scottish HEIs and 10.4% for UK HEIs in 2022/23 according to HESA statistics.
- The University’s median gender pay gap is 10.9% compared to a UK HEI median gap of 8.5% and a Scottish HEI median pay gap of 16.2%. It has increased from 10.1% in 2022.
- Ethnicity - The overall average ethnicity pay gap is in favour of BME staff at -4.0%. It has decreased in favour of White staff since 2022 by 0.3 percentage points (from -4.3%). This represents the difference between average hourly pay for BME and White staff and does not include staff who have not disclosed their ethnicity. This change suggests that the gap is closing towards parity between White and BME average hourly pay.
- Disability - The average disability pay gap is in favour of non-disabled staff at 7.3%. This has increased since 2022 by 8 percentage points from a 1.3% gap in favour of disabled staff. This may have been caused in part by a decrease in the disclosure rate relating to disability since 2022. This is the difference between staff who have disclosed that they have a disability and those who have made a disclosure that they do not have a disability, so excludes staff whose status is unknown. Further work is required to examine the large change in the disability pay gap.
Gender – Salary quartiles and pay gap
The salaried staff distribution by Sex at 1st January was 58.7% Female and 41.3% Male.
Figure 1: Staff by Sex

The table below shows the percentage of staff in each salary quartile by sex. It shows that over 63% of staff in the lowest pay quartile are female and 52% of staff in the lower mid quartile are female. The split by sex in the upper mid salary quartile is almost even at 49.5% female, while there is a significant imbalance in favour of male staff in the highest salary quartile - 69% of staff in this quartile are male but male staff comprise only 41% of the whole staff population.
Table 1: Percentage of Staff by Salary Quartile
| Pay Quartile | Female | Male |
|---|---|---|
| a. Lower Quartile | 63.1% | 36.9% |
| b. Lower Mid Quartile | 52.3% | 47.7% |
| c. Upper Mid Quartile | 49.5% | 50.5% |
| d. Upper Quartile | 31.0% | 69.0% |
| All Staff | 58.7% | 41.3% |
The table below shows the average hourly pay for male and female staff
Table 2: Average Hourly Pay by Sex
| Sex | Average Hourly Pay |
|---|---|
| Female | £25.46 |
| Male | £29.87 |
| All Staff | £27.29 |
The average hourly pay for female staff is £25.46, which is £4.41 lower than the male average hourly pay of £29.87.
The average gender pay gap is 14.8%.
This has increased slight since 2022 from 14.0%. It is slightly higher than the Scottish HEI average gender pay gap in 2022/23 which was 14.4%. It is 4.4 percentage points higher than the 2022/23 UK HEI average gender pay gap.
The following table shows the median hourly pay for male and female staff
Table 3: Median Hourly Pay by Sex
| Sex | Hourly Pay |
|---|---|
| Female | £22.76 |
| Male | £25.54 |
| All Staff | £24.81 |
The median hourly pay for female staff is £2.78 lower than male staff at £25.54.
The median hourly gender pay gap is 10.9%.
This is higher than the HESA UK HEIs’ median pay gap of 8.5% and significantly lower than the median pay gap reported by Scottish HEIs in 2022/23 which was 16.2%.
The table below shows average hourly pay and average pay gap by sex and grade:
Table 4: Average Pay Gap by Grade
| Grade | Female | Male | All | Pay Gap |
|---|---|---|---|---|
| Clinical Consultant | £75.58 | £76.64 | £76.23 | 1.4% |
| Clinical Lecturer | £39.47 | £38.43 | £39.03 | -2.7% |
| Estates Apprentice | £8.63 | £8.63 | N/A | |
| Grade 1 | £12.60 | £12.60 | £12.60 | 0.0% |
| Grade 2 | £12.82 | £13.92 | £13.33 | 7.9% |
| Grade 3 | £13.29 | £15.46 | £14.37 | 14.1% |
| Grade 4 | £14.01 | £14.45 | £14.11 | 3.0% |
| Grade 5 | £15.55 | £15.85 | £15.63 | 1.9% |
| Grade 6 | £18.74 | £18.81 | £18.76 | 0.3% |
| Grade 7 | £23.15 | £23.17 | £23.16 | 0.1% |
| Grade 8 | £28.83 | £29.10 | £28.95 | 0.9% |
| Grade 9 | £35.54 | £35.96 | £35.75 | 1.2% |
| Grade 10 | £51.13 | £52.90 | £52.16 | 3.3% |
| MRC PAY BAND 3B | £31.72 | £29.74 | £30.73 | -6.6% |
| MRC PAY BAND 4B | £25.37 | £25.37 | N/A | |
| MRC PAY BAND 5B | £20.03 | £21.73 | £20.88 | 7.8% |
| Nursery Grade 3 | £15.80 | £15.80 | N/A | |
| Offscale Grades 1-6 | £13.18 | £13.12 | £13.16 | -0.5% |
| Offscale Grades 7-10 | £57.09 | £58.22 | £57.63 | 1.9% |
| Reader or Clinical Senior Lecturer (Non-Consultant) | £55.67 | £54.48 | £55.22 | -2.2% |
| All Staff | £25.46 | £29.87 | £27.29 | 14.8% |
The largest average pay gap occurs at Grade 3 with a gap of 14.1%. A small number of areas have a gender gap in favour of female staff: Clinical Lecturer; MRC Band 3B; Reader or Clinical Senior Lecturer (Non-Consultant); and Offscale Grades 1-6.
The tables below show the average hourly pay for male and female staff by mode of employment (Full Time or Part-Time) and basis (Temporary or Permanent):
Table 5: Average Pay Gap by Mode of Employment
| Mode | Female | Male | All | Pay Gap |
|---|---|---|---|---|
| Full-Time | £25.38 | £29.46 | £27.23 | 13.9% |
| Part-Time | £25.67 | £31.83 | £27.48 | 19.3% |
| All Staff | £25.46 | £29.87 | £27.29 | 14.8% |
The average gender pay gap in favour of male staff is considerably higher among part time staff at 19.3%, compared to a gap of 13.9% for full time staff. This suggests that part time male staff tend to hold higher paid positions that female staff.
There is very little difference between part time and full time average hourly pay for female staff (just £0.29 or 1%) whereas male part time staff are likely to be paid more (£2.37 per hour or 7.4%) than their full time counterparts.
Table 6: Average Pay Gap by Employment Basis
| Basis | Female | Male | All | Pay Gap |
|---|---|---|---|---|
| Permanent | £25.58 | £31.06 | £27.82 | 17.6% |
| Temporary | £24.85 | £24.46 | £24.68 | -1.6% |
| All Staff | £25.46 | £29.87 | £27.29 | 14.8% |
The average gender pay gap in favour of male permanent staff is considerably higher than temporary staff at 17.6%. The pay gap for temporary staff is marginally in favour of women at -1.6%.
There is a striking difference in average rates of pay between male and female staff when comparing permanent and temporary staff. Permanent female staff are likely to earn only £0.73 (2.9%) more than female temporary staff. Male permanent staff on the other hand are likely to earn £6.60 (21%) more that male temporary staff.
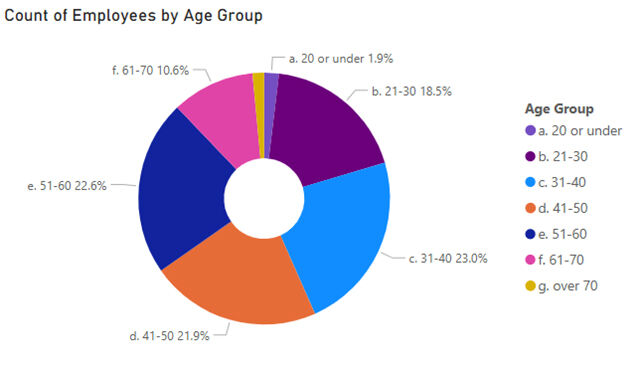
Figure 2: Staff by Age group
a. 20 years or under 1.9%
b. 21 - 30 years - 18.5%
c. 31 - 40 years - 23.0%
d. 41 - 50 years - 21.9%
e. 51 - 60 years - 22.6%
f. 61 - 70 years - 10.6%
The following table shows the average hourly pay for male and female staff by age group.
Table 7: Average Pay Gap by Age Group
| Age Group | Female | Male | All | Pay Gap |
|---|---|---|---|---|
| a. 20 or under | £11.21 | £8.53 | £9.49 | -31.5% |
| b. 21-30 | £17.02 | £17.25 | £17.11 | 1.4% |
| c. 31-40 | £24.22 | £25.35 | £24.70 | 4.5% |
| d. 41-50 | £28.35 | £31.35 | £29.62 | 9.6% |
| e. 51-60 | £27.62 | £34.66 | £30.29 | 20.3% |
| f. 61-70 | £25.10 | £37.00 | £30.20 | 32.2% |
| g. over 70 | £26.57 | £41.47 | £34.21 | 35.9% |
| All Staff | £25.46 | £29.87 | £27.29 | 14.8% |
There is an average pay gap in favour of female staff among our youngest employees aged 20 or under. While this is a relatively small cohort of staff it remains significant especially when taken in the context of the pay gap trend by age group.
The average gender pay gap grows with each step up in age group, resulting in the highest gender pay gap persisting among the oldest staff age group – a gap of 35.9% among staff aged over 70. This is a small cohort but is consistent with the overall pattern. Among all staff age groups over 50, the pay gap is larger than for all staff while all age groups below age 50 have a pay gap which is smaller than the overall gap.
Ethnicity Pay Gap
Figure 3: Staff by Ethnicity
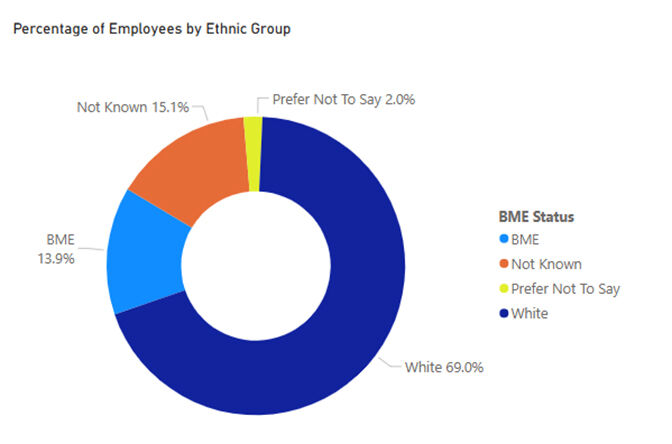
The table below shows average hourly pay for White and BME staff. It shows that across the University, the hourly pay for BME staff is slightly higher at £28.36 than for White staff at £27.22.
Table 8: Average Hourly Pay by Ethnic Group
| Ethnic Group | Average Hourly Pay |
|---|---|
| BME | £28.36 |
| White | £27.22 |
| All Staff | £27.40 |
Note that the average hourly pay for all staff is £27.29. The total in this table is different as data on ethnicity is not held for all staff. This table shows the gap for staff where data is known.
The Ethnicity Pay Gap is -4.0% in favour of BME staff.
The table below shows average hourly pay for BME and White staff by Grade.
Table 9: Average Ethnicity Pay Gap by Grade
| Grade | BME | White | All | Pay Gap |
|---|---|---|---|---|
| Clinical Consultant | £74.93 | £77.09 | £76.59 | 2.8% |
| Clinical Lecturer | £37.20 | £39.83 | £39.29 | 6.6% |
| Estates Apprentice | £12.75 | £12.75 | N/A | |
| Grade 1 | £12.60 | £12.60 | £12.60 | 0.0% |
| Grade 2 | £13.45 | £13.45 | N/A | |
| Grade 3 | £17.16 | £14.19 | £14.25 | -20.9% |
| Grade 4 | £13.35 | £14.22 | £14.16 | 6.1% |
| Grade 5 | £14.82 | £15.70 | £15.65 | 5.6% |
| Grade 6 | £18.44 | £18.85 | £18.79 | 2.2% |
| Grade 7 | £23.18 | £23.25 | £23.23 | 0.3% |
| Grade 8 | £28.35 | £29.04 | £28.93 | 2.4% |
| Grade 9 | £35.45 | £35.82 | £35.77 | 1.0% |
| Grade 10 | £47.73 | £52.99 | £52.32 | 9.9% |
| MRC PAY BAND 3B | £30.73 | £30.73 | N/A | |
| MRC PAY BAND 4B | £25.37 | £25.37 | N/A | |
| MRC PAY BAND 5B | £20.88 | £20.88 | N/A | |
| Offscale Grades 1.6 | £8.91 | £13.37 | £12.92 | 33.4% |
| Offscale Grades 7-10 | £51.92 | £58.52 | £57.34 | 11.3% |
| Reader or Clinical Senior Lecturer (Non-Consultant) | £41.80 | £57.14 | £55.22 | 26.8% |
| All Staff | £28.36 | £27.22 | £27.40 | -4.2% |
The largest average pay gap exists in Grade 3, in favour of BME staff, and then with Offscale Grades 1-6 and Reader or Clinical Senior Lecturer, which is in favour of White staff. However, with the significant nonresponse rate to the ethnicity in the overall data set, this is an inconclusive conclusion.
Disability Pay Gap
Figure 4: Staff by Disability Disclosed
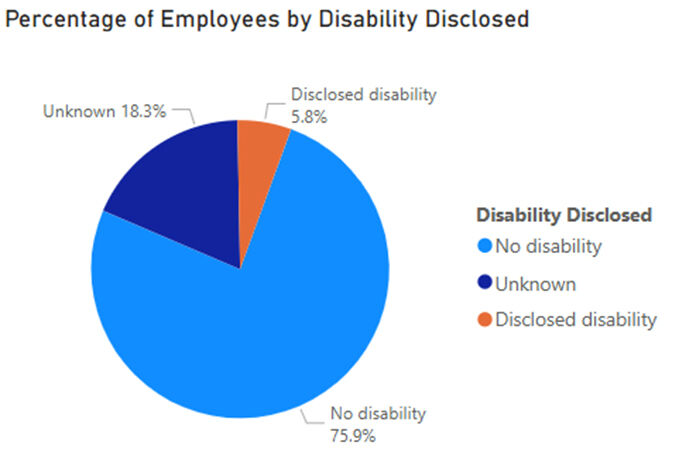
The table below shows average hourly pay for Disabled and non-disabled staff where a disclosure has been made. It shows that across the University, the hourly pay for disabled staff is lower at £25.74 than for non-disabled staff at £27.75.
Table 10: Average Hourly Pay by Disability Disclosed
| Disability | Average Hourly Pay |
|---|---|
| Disclosed disability | £25.74 |
| No disability | £27.75 |
| All Staff | £27.60 |
Note that the average hourly pay for all staff is £27.29. The total in this table is different as data on disability is not held for all staff. This table shows the gap for staff where data is known.
The Disability Pay Gap is 7.3%.
The table below shows the average hourly pay and pay gap for staff who have disclosed that they have a disability, and those who disclosed that they have no disability, by grade.
Table 11: Average Disability Pay Gap by Grade
| Grade | Disclosed disability | No disability | All | Pay Gap |
|---|---|---|---|---|
| Clinical Consultant | £82.82 | £76.68 | £76.91 | -8.0% |
| Clinical Lecturer | £41.56 | £38.93 | £39.10 | -6.7% |
| Grade 1 | £12.60 | £12.60 | £12.60 | 0.0% |
| Grade 2 | £13.45 | £13.45 | N/A | |
| Grade 3 | £12.98 | £14.58 | £14.45 | 10.9% |
| Grade 4 | £13.71 | £14.27 | £14.19 | 3.9% |
| Grade 5 | £15.23 | £15.74 | £15.70 | 3.3% |
| Grade 6 | £18.20 | £18.87 | £18.82 | 3.5% |
| Grade 7 | £23.32 | £23.31 | £23.31 | 0.0% |
| Grade 8 | £29.11 | £28.95 | £28.96 | -0.5% |
| Grade 9 | £35.69 | £35.76 | £35.76 | 0.2% |
| Grade 10 | £50.18 | £52.01 | £51.89 | 3.5% |
| MRC PAY BAND 3B | £30.73 | £30.73 | N/A | |
| MRC PAY BAND 4B | £25.37 | £25.37 | N/A | |
| MRC PAY BAND 5B | £20.88 | £20.88 | N/A | |
| Nursery Grade 3 | £15.80 | £15.80 | N/A | |
| Offscale Grades 1.6 | £12.64 | £13.33 | £13.29 | 5.2% |
| Offscale Grades 7-10 | £57.58 | £57.41 | £57.42 | -0.3% |
| Reader or Clinical Senior Lecturer (Non-Consultant) | £59.13 | £53.92 | £54.66 | -9.7% |
| All Staff | £25.74 | £27.75 | £27.60 | 7.3% |
The largest average pay gap exists in Grade 3, in favour of non-Disabled staff, and then with Clinical Consultants and Reader or Clinical Senior Lecturer, which is in favour of Disabled staff. However, with the significant nonresponse rate to the disability in the overall data, like ethnicity, this is an inconclusive reflection.